 |
Comparative analysis of greenhouse gas
emissions from major cities of India |
 |
1Department of Civil Engineering, Manipal Institute of Technology, Manipal, Karnataka, India
2Energy and Wetlands Research Group, Centre for Ecological Sciences (CES),
Indian Institute of Science (IISc), Bangalore, Karnataka, India
*Corresponding author: cestvr@ces.iisc.ac.in
Results and Discussion
GHG emissions from energy sector
The major sectors for which greenhouse gases are
assessed under electricity consumption are
consumption in domestic sector, commercial sector,
industrial sector and others (public lighting,
advertisement boardings, railways, public water
works and sewerage systems, irrigation and
agriculture). Emissions resulting from electricity
consumption in domestic sector and industrial sectors
are attributed to domestic sector along with the
emissions from fuel consumption in this sector and
industrial sector along with emissions occurring from
industrial processes
GHG emissions from electricity consumption in
commercial sector and other sectors are represente
in isolation for the comparative analysis. among the
cities. Emissions resulting from auxiliary power
consumption in plants located within the city
boundary and from the supply loss is also calculated
in this study. Figure 1 illustrates the emissions
resulting from electricity consumption in commercial
and other sectors along with auxiliary consumption in power plants and supply losses. In Delhi the emission
from commercial sector due to power consumption is
5428.55Gg of CO2 eq, others is 2099.11 Gg of CO2
eq and form auxiliary consumption and supply loss is
857.69 Gg of CO2 eq which is highest among all the
cities.
GHG emissions from domestic sector:
Domestic sector is a major sector which contributesto the considerable amount of emissions when city
level studies are carried out. The major sources
include electricity consumption for lighting and other
household appliances and consumption of fuel for
cooking. In the present study greenhouse gases
emitting from electricity consumption in domestic
sector and fuel consumption are accounted. The
major fuels used in this study are LPG, Piped Natural
Gas (PNG) and kerosene based on the availability of
data. Total greenhouse gas emissions converted in
terms of CO2 equivalent from the domestic sector in
major cities is shown in the Figure 2. In Delhi during
the study base year 2009, 11690.43 Gg of CO2
equivalents is emitted from the domestic sector
which is the highest among all the cities. Electricity
consumption accounted for 9237.73 Gg of emissions
out of the total domestic emissions.
GHG emissions from transportation sector:>
In the major cities transportation sector is one of the
major anthropogenic contributors of greenhouse
gases (Mitra and Sharma, 2002). Emissions resulting
from total vehicles registered within the city
boundary and also from CNG fuelled vehicles
present in few of the major cities are calculated.
Emissions resulting from road transportation
including CNG vehicles and also in port cities of
India are as depicted in Figure 3.
In Delhi during the year 2009-10, total number of
registered vehicles was 6451883, out of which there
were around 20 lakhs of cars and jeeps and 40.5
lakhs of motor cycles including scooters and mopeds.
CNG fuelled vehicles emitted 1527.03 Gg of CO2
equivalents whereas the remaining vehicles resulted
in 10867.51 Gg of emissions which is the highest
among all the major cities
GHG emissions from industrial sector:
As shown in the figure 4 emissions are estimated
from the major industrial processes emitting
considerable greenhouse gases which are located
within the city boundary. Electricity consumption in
industrial sector is taken into account using which the
resulting emissions are calculated. Fuel consumption
data is also used in few of the industries to estimate
the emissions. Iron and steel industry, cement
industry, fertilizer plants and chemical manufacturing
are the few major industries which releases huge
amount of greenhouse gases into the atmosphere
during the process. Emissions are calculated from the
major polluting industries in city boundaries as the data is not available for small and medium scale
industries.
Though this study does not present the entire
emissions across industrial sector in acityduetounavailabilityofdata,themajorgreenhousegasemitting industries are included in the study along
with the electricity consumption which constitutesmost of the emissions. Figure 4 shows that Chenna
emits 4472.35GgofCO2eqand it is the greater
emitter of GHG.
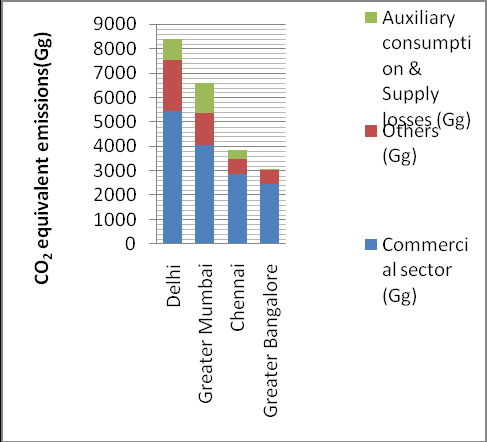
Fig. 1. Carbon dioxide equivalent emissions (CO2 eq)
from electricity consumption.
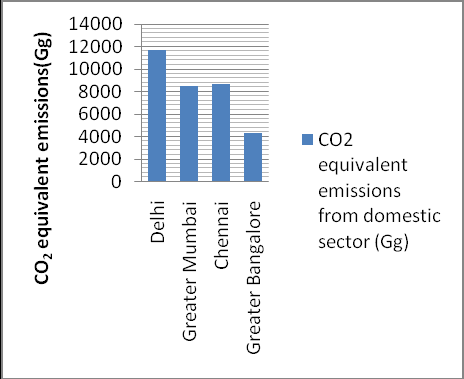
Fig. 2. Carbon dioxide equivalent emissions (CO2 eq)
from domestic sector
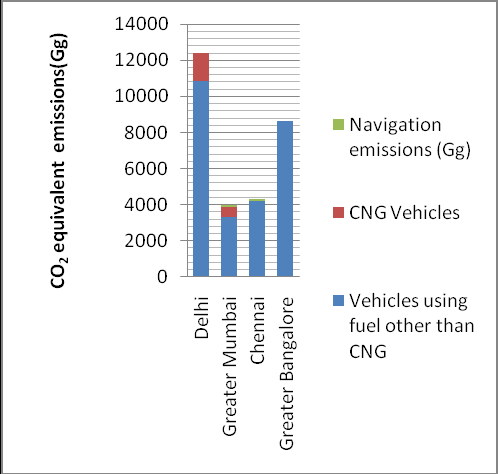 Fig 3. Carbon dioxide equivalent emissions (CO2 eq)
from transportation sector
Fig 3. Carbon dioxide equivalent emissions (CO2 eq)
from transportation sector
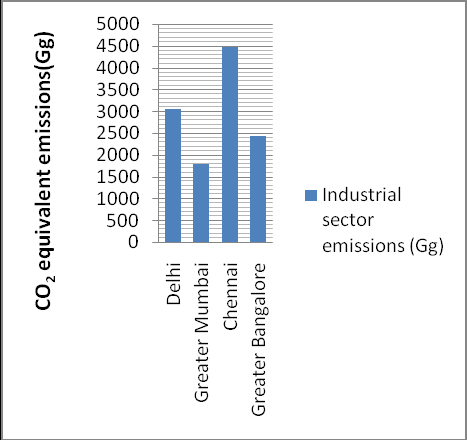
Fig 4: Carbon dioxide equivalent emissions (CO2
eq) from industrial sector.
GHG emissions from agricultural related
activities:
Methane (CH4) emissions from paddy cultivation,
nitrous oxide (N2O) emissions from soil management
are the major sectors responsible for greenhouse gas
emissions from this sector. Crop residue burning is
practiced in few of the Northern parts of the India
which also releases GHG emissions. In the current
study emission inventory is carried out from these
three sectors under agriculture related activities. The
pattern of carbon dioxide equivalent emissions in the
major cities from agricultural activities is as shown in
the Figure 5.
Emissions from paddy cultivation are calculated for
two major cities based on the area of paddy fields.
Carbon dioxide equivalents were found to be 17.05
Gg in Delhi and 5.10 Gg in Greater Bangalore
respectively. Emissions resulting from burning of
crop residues at the end of growing year ar
estimated based on Delhi’s emission of 2.68 Gg of
CO2 equivalents. N2O emissions are converted into
CO2 equivalents. There are no agricultural activities in most of the cities which indicates decline in agricultural practices as a result of increasing
urbanization.
GHG emissions from livestock management:
Enteric fermentation and manure management are the
two major activities resulting in the emission of
greenhouse gases from animal husbandry. In the
present study emissions from livestock management
is carried out to calculate the emissions resulting
from enteric fermentation and manure management
in the major cities. Livestock population for cities is
obtained for cities using 2003 and 2007 livestock
census, using which the number of livestock is
extrapolated to the inventory year 2009 (MOA, 2000;
MOA, 2005; MOA, 2007). The emission estimates
for the major cities are as shown in figure 6. Delhi
and Greater Bangalore are the major cities which emits higher amount of greenhouse gases due to
animal husbandry.
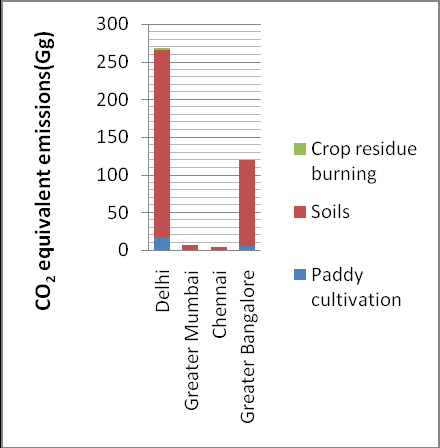
Fig. 5. Carbon dioxide equivalent emissions (CO2 eq)
from agricultural activities
GHG emissions from waste sector:
In the current study greenhouse gas emissions from
two major waste sectors are calculated: municipal
solid waste, domestic waste water. CH4 emissions
from municipal solid waste disposal data are obtained
from the local city municipality. CH4 and N2O
emissions are calculated from domestic sector. In this
study the industrial waste water emissions is not
calculated because of non availability of the data.
The emission estimates from waste sector for the
major cities are as shown in figure 7.
The emissions depend on the parameters like amount
of waste disposed, methane correction factor,
degradable organic carbon and oxidation factor
(IPCC, 2006). Waste disposal at cities is a major
source of anthropogenic CH4 emissions these days.
CH4 and N2O emissions from domestic water are
calculated on the basis of population of the city.
From the current inventories, major emitters from domestic waste water sector are cities Delhi, Greater
Mumbai and Greater Bangalore which emit 1378.75
Gg, 1058.09 Gg and 759.29 Gg of CO2 equivalents
respectively.
Comparative analysis of Carbon footprint:
Economic activity is a key factor that affects
greenhouse gas emissions. Increase in economy
results in rise in demand for supply of energy and
energy-intensive goods which will also increase the
emissions. On the other hand, growth in the economy
of a country results in improvement in technologies
and promotes the advancement of organizations
which aims at environmental protection andmitigation of emissions. In this study, total carbon
dioxide equivalent emissions emitted from different
major cities are compared with their economic
activity, measured in terms of GDP. The results
shows that CO2 equivalent emissions from Delhi,
Greater Mumbai, Chennai, Greater Bangalore, are
found to be 38633.2 Gg, 22783.08 Gg, 22090.55 Gg, 19796.5 Gg, respectively.
Figure 8 shows the relationship between carbon
dioxide equivalent emissions per capita to GDP per
capita. Chennai emits 4.79 tonnes of CO2 equivalent
emissions per capita which is the highest among all
the cities, followed by Delhi which emits 2.40 tonnes
of CO2 equivalent emissions per capita.
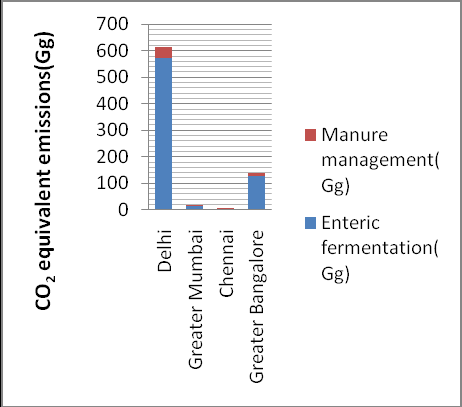
Fig. 6. Carbon dioxide equivalent emissions (CO2 eq)
from livestock management.
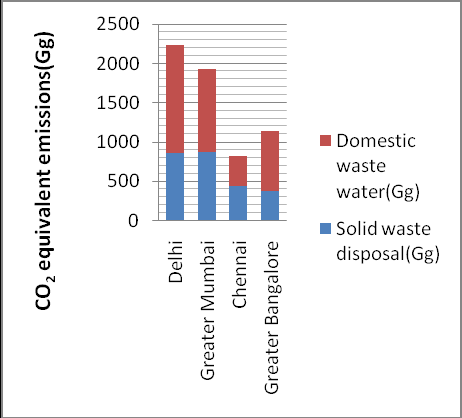
Fig. 7. Carbon dioxide equivalent emissions (CO2eq)
from waste sector.
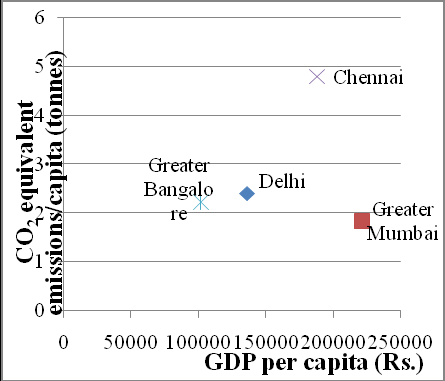
Fig. 8. CO2 eq. emissions per capita versus GDP per
capita for all the cities.
Citation :Sridevi H , Shreejith K. , T. V. Ramachandra, Comparative analysis of greenhouse gas emissions
from major cities of India
2International Journal ofRenewable Energy and Environmental Engineering
ISSN 2348-0157, Vol. 02, No. 01, January 2014.
|
|